Debug a script before writing a client
Start websocketd with --devconsole and it serves a test page from the
same port as your endpoint. You can connect, send frames, and read
exactly what your script writes, without writing a line of client code.
websocketd --port=8080 --devconsole ./myscript.sh
Open http://localhost:8080/ in a browser. The console works out its own
WebSocket target from the page URL, so the address bar is already filled
in with ws://localhost:8080/. Press Connect, or Enter in the
address bar.
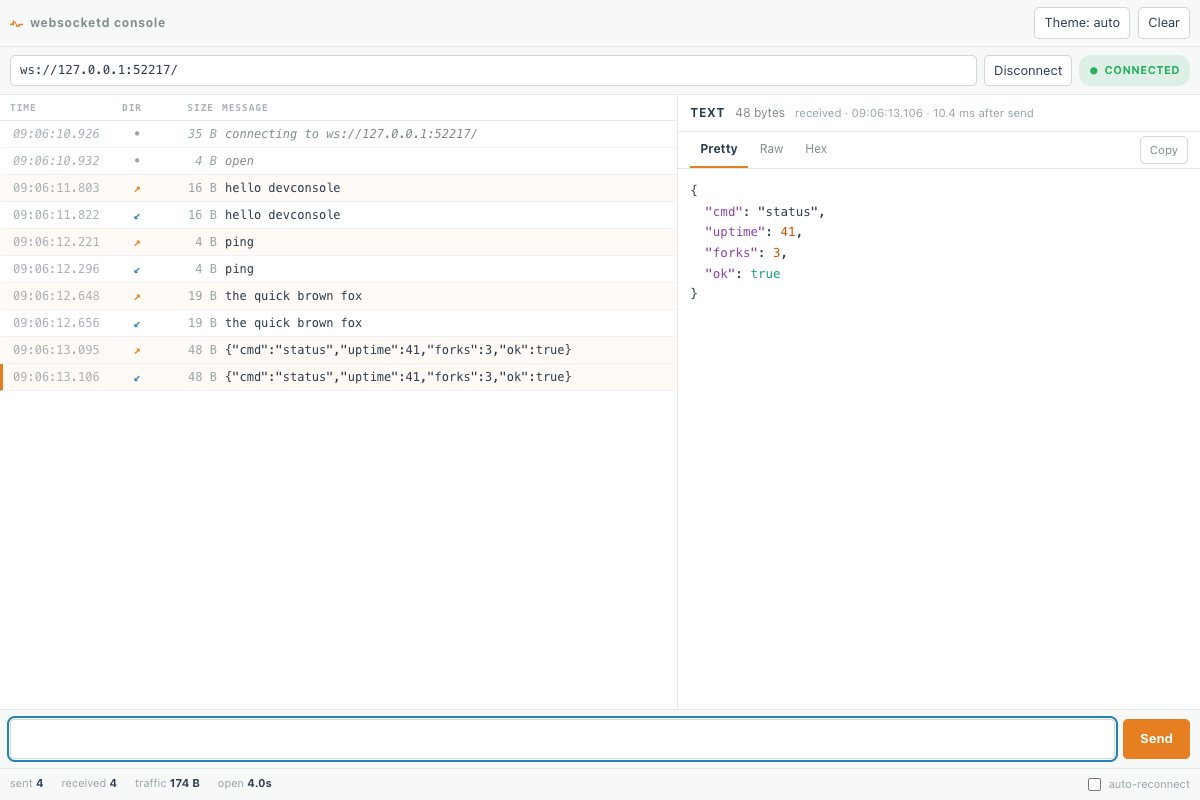
Send a frame and read the reply
Type into the box along the bottom and press Enter, or Send. Each frame appears as a row in the middle list, with the time it happened, an arrow giving its direction, its size in bytes, and the text itself. Sent and received frames sit in the same list in the order they occurred, which is what makes a missing reply or an out-of-order one obvious.
Every line your script writes to stdout becomes one received frame, because a newline is the frame boundary. If your script prints a burst of output and the console shows nothing for several seconds and then all of it at once, the problem is not websocketd: your language is buffering. The fix is on your language's page, from Python to C , and the reason is in output buffering .
Click a row and the right-hand pane shows that one frame in full: its size, when it arrived, how long after the frame you sent, and the payload under Pretty, Raw or Hex. Pretty formats JSON, so a malformed response is visible as soon as it fails to format. Hex is the one to reach for when a frame looks right and is not: a stray carriage return, a byte-order mark, or trailing whitespace shows up there and nowhere else.
The footer counts frames sent and received, total traffic, and how long the connection has been open. Watch the open time to catch a connection that is being dropped and silently remade.
See your script's stderr
By default your script's stderr does not reach the browser. It is written to websocketd's log, on websocketd's own stdout, tagged at error level:
ERROR | stderr | url:'http://127.0.0.1:8080/' ... | to stderr, from the script
To see it in the console alongside the output, add --passstderr:
websocketd --port=8080 --devconsole --passstderr ./myscript.sh
Both streams then arrive as tagged JSON, one object per frame:
{"stream":"stdout","data":"HTTP_X_AUTH_USER=[ada]"}
{"stream":"stderr","data":"to stderr, from the script"}
--passstderr wraps stdout too, so the frames
your real client receives are no longer the bare lines your script
printed. It is a debugging flag, not a production one. Server-side
logging of stderr happens either way, so turning it off loses you nothing
but the browser view.
One HTTP surface, one owner
--devconsole cannot be combined with --staticdir or --cgidir. All
three want to answer plain HTTP requests, and websocketd refuses to start
rather than pick one:
FATAL | server | Invalid parameters: --devconsole cannot be used with --staticdir. Pick one.
It exits with code 4. Use --devconsole while you are writing the
script, and switch to --staticdir once you have a client page of your
own. The exit code reference
lists the rest.
While --devconsole is on, the console page is what every HTTP path
returns, so http://localhost:8080/anything serves the console too. That
is deliberate: it means the console is reachable at the same URL as the
endpoint you are testing, including under --dir.
Next
- Dev console is the exact contract: what the page is, what it serves, and the policy it runs under.
- Message framing
explains why one
line is one frame, and what
--binarychanges. - Pass data into your script covers testing an endpoint that expects a query string.